Insights
Azure Data Warehouse in Weeks not Months
- Category
- Blog
- Date published
- 30.11.2021
I had the pleasure of working with a client on an Azure Data Warehouse POC recently and thought I’d share some of the thoughts, processes and methodologies I adopted. The key thing was delivering a viable product in a number of weeks, four to be precise.
Now I’m not claiming to of delivered an Enterprise grade data warehouse incorporating all of the organisations data modelled perfectly for analytical purposes in four weeks. That would be impressive, although set me that challenge and I’ll give it a good go. No, instead I’m claiming to have understood their requirements, reviewed their technology landscape, proposed my solution, gained buy in from their team and physically built an end to end Azure Data Warehouse POC. Oh, and I may of left them the full solution documented as well.
The Requirement
The organisation was migrating to the Azure Cloud from both a transactional system and analytics perspective. There was appetite to build an Enterprise Data Warehouse within the Azure Cloud crossing over all of the organisations business processes such as Finance, HR, Procurement and Sales.
Plan of Attack
Having a relatively clean slate to work from I set out to understand the source systems involved, master data solutions that were in place, if any, and essentially where I was going to source all of the core business data from.
I was also discussing a variety of methodologies to adopt for the data warehouse, and after looking at Inmon, Data Vault, large flat tables with an MPP approach and Kimball I made a decision to proceed with Kimball. Why? Well quite frankly it just works and was the best fit for the requirement. It allows you to build a data warehouse solution that will significantly reduce the complexity of your data sets by gradual de-normalisation, reduce redundancy of your data and provides a set of conformed dimensions that can be re-used time and time again. My experience of Kimball is that it is also the most user engaging as it presents to the consumer very intuitively.
Bus Matrix, Conceptual & Logical Model
So the decision was made. We were proceeding with Kimball and the technology was never in question, Azure all the way. Although the Azure components were still up for grabs.
All well designed Kimball data warehouses start off with a well defined bus matrix. I get mixed responses to the bus matrix. I have clients who think it’s great, I have clients who go through the motions and let it happen, and I have clients who look at me as though I’m suggesting a game of noughts and crosses when I draw it on the whiteboard. One thing they all agree on at the end of the process though is it’s a valuable exercise.
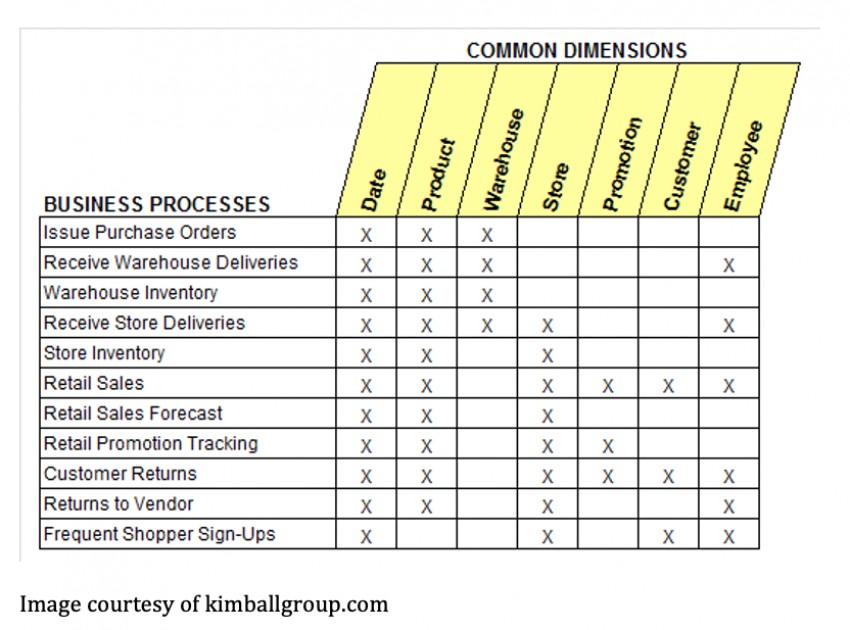
The bus matrix is a way of mapping out at a very high level what business processes you would like to report on and by what dimensionality types and entities you wish to slice them by. A well-defined bus matrix should reflect how your business operates. So what does it look like? Well, a little something like this.

At a bus matrix level we learn things like the Retail Sales business need to be able to report by Date, Product, Store, Promotion, Customer and Employees. We don’t even need to concern ourselves with metrics or specific attributes at this stage, just a high level understanding of how the business operates and wishes to report. Every business process will likely require some form of time or date based reporting. I’m yet to find one that doesn’t. If you do though then please let me know. Basic questions like “when did this happen” need to be answered.
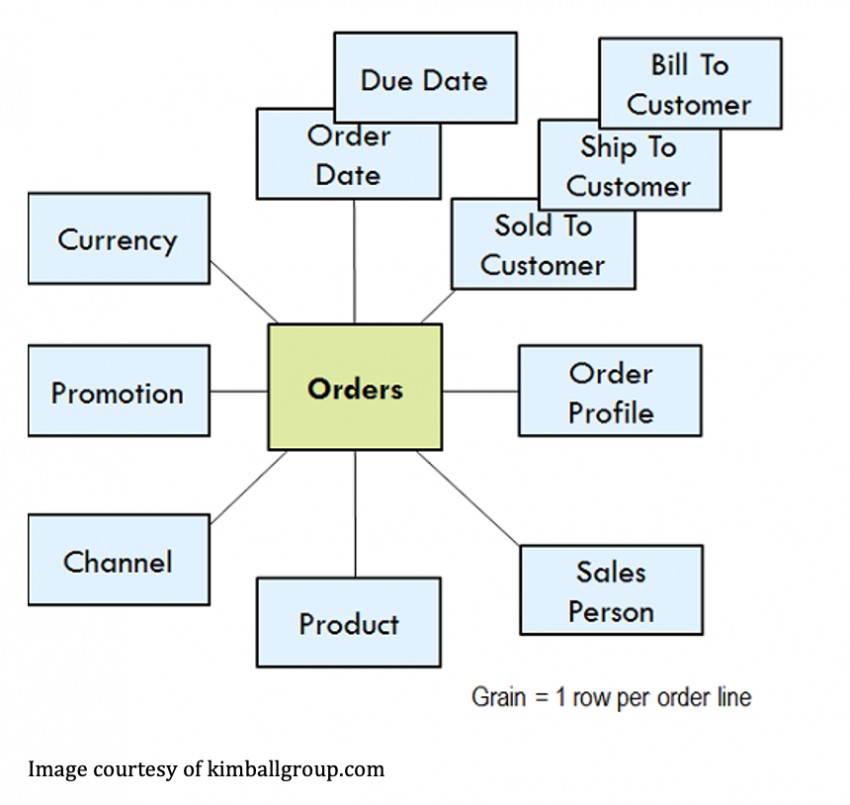
The bus matrix falls very nicely into the creation of your conceptual models. Kimball follows a star schema based approach. So following that approach I know from the above that I’m going to need at least eleven star schemas. One for each business process. The star schemas will have at the centre of them one fact table with multiple dimensions slicing the fact and may look something like this.

Seems easy right? Well despite how it looks, getting to this point can have a number of challenges. Mainly agreeing requirements, and everything from here on in gets gradually more complex. At this stage the conceptual model is exactly that, it’s “conceptual”. It helps us understand at a high level what our models may look like and act as a starting point for more detailed design.
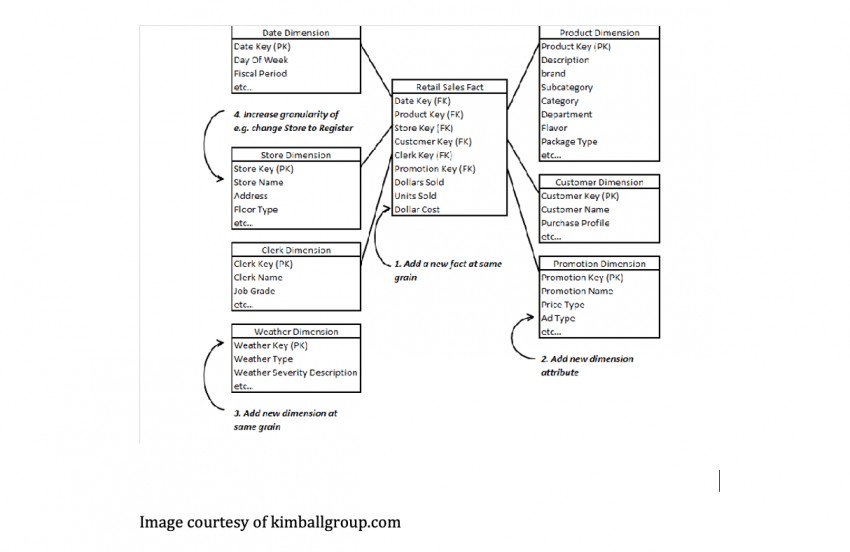
So I have my bus matrix and my conceptual model and now its time to load the models with metrics and attributes relevant to the defined grains. I’m now ready to move into the logical model design, and I start to realise things like I need more than one Fact table for each business process. There are metrics that require analysis at different levels of granularity. That’s ok though and is fully expected. Using a Finance fact as an example, at a minimum it breaks down into two facts. One for General Ledger Balances, the other for General Ledger Transactions. But then you consider other Finance sub processes such as Accounts Receivable and Accounts Payable and you can easily throw in a couple of additional fact tables there too. Importantly though they will all share common dimensions. A logical model may look something like this.

The Physical Model and Technology Solution
We already know we’re building in Azure and through the work I’d done in my bus matrix, conceptual and logical modelling I know what my end state presentation layer data models need to look like. Just the small matter of getting my source data ingested, designing and building some pipelines and getting everything built into physical models. Here’s how we went about that.
I was dealing with source and transactional data that was split between on premise applications and excel data files. Can’t beat an excel data file as your source.
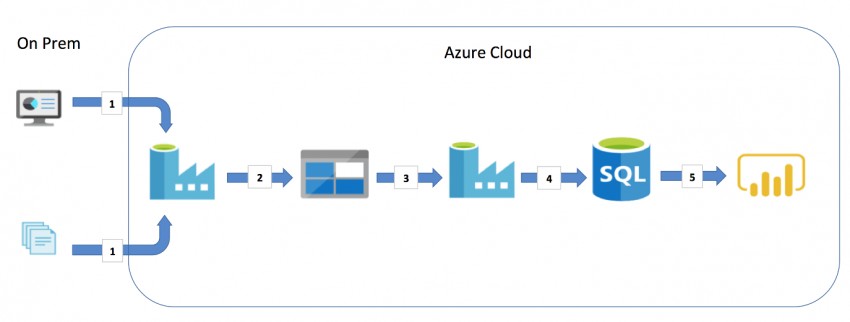
As time was of the essence I selected one of the core business processes (Sales) to model end to end in order to prove the concept and provide the blueprint for the Enterprise Data Warehouse. The Azure components selected were Data Factory for the ETL / ELT, Blob Storage for the staging Data Lake, and a SQL DB for the presentation layers of the data warehouse. Why not use a SQL DW / Azure Synapse you say? Good question, I’m pleased you asked. Well, cost for one, as the pricing for a SQL DW rockets in comparison to a SQL DB. But cost wasn’t the only factor. Having analysed the requirements and identifying the vast amount if not all reporting requirements as day plus one, as well as the methodology selected being Kimball I thought a SQL DB was at this stage more appropriate. We can always switch it later right?
Here’s a walk through of the physical solution POC at a high level. Once I ticked the boxes of creating the Azure subscription and resource group I was ready to go. Oh, and a couple of firewall settings tweaked too.
1: I needed to get on premise application data and external data files ingested into the Azure Cloud. To do this I opted to use Data Factory as an orchestration tool for the ETL. I created a series of data pipelines, which in the Oracle world, and this is the old school Oracle BI Apps side of me coming out, you may call Source Dependent Extract (SDE) pipelines. Why? Because they’re dependent on the source that you’re extracting from.
2: As an intermediate storage / staging layer I opted to use blob storage which was populated by the Data Factory Source Dependent Extract (SDE) pipelines to generate data files from the application and external data file data. The file format was variable, I opted for csv but JSON would of worked just as well. As storage in the cloud via blob storage is so cheap we don’t have to be so concerned about storing daily snapshots of our data. This helps with the management of the delta / incremental loads into the presentation model.
3: So I’ve populated my blob storage staging layer, much of which is one to one mappings to application tables and I have a mechanism built into my Data Factory pipelines to either truncate and perform a full load or to load deltas from source. Great, so I’ve moved all my application data of relevance from A right into B(lob) storage. So what now?
4: This is where the magic starts to happen. Again using old school Oracle BI Apps terminology I now need to develop a series of Data Factory Source Independent Load (SIL) pipelines (named such because they’re independent of source applications, usually extracting from a staging layer) to gradually de-normalise my staged data into star schema format within my SQL DB. There were a variety of options available to me here from which Data Factory would provide the orchestration, such as Databricks and HDInsight. In the interest of keeping the POC simple, and also leveraging the in house capability of the team I opted to use SQL Stored Procedure logic.
The SIL pipelines created my conformed dimensions and fact tables, but now I have in the region of ten SDE and SIL pipelines. To make the process of managing and running these pipelines in the correct sequence easier I then created a master pipeline to reference and orchestrate them.

5: I have deliberately not mentioned any visualisation or BI tool technology thus far. That’s because in reality a well-built data warehouse can be used by an array of visualisation tools and is largely technology agnostic. The data lake may also be used for non-analytics purposes. This particular project used Power BI for reporting and visualisations, but this could just as easily of been Tableau, Oracle Analytics Cloud or any other BI tool for that matter. Tableau are introducing some great functionality (Relationships) on their data model that will work perfectly with a well-designed Kimball data warehouse, something I will almost certainly blog on soon.
For more information on how we can help you transition to a cloud data warehouse or perhaps discuss the contents of this blog in more detail please do get in touch at info@seriosgroup.com. We’re experienced across the Azure, AWS and Oracle Cloud as well as being able to fully test your solution end to end from an Assurance perspective.


